Which software is the best for professional audio testing? Comparison of professional audio testing software applications
Keywords: building acoustics test, equipment system test, acceptance test, frequency response display, phase correction, delay compensation, reverberation measurement, language clarity, sound field uniformity, signal-to-noise and sound insulation, various types of distortion
-
1. Introduction
In the previous article, we introduced some simulation software for point sound source and line array speaker placement and hanging, which provided a good application reference for practitioners to design the sound reinforcement system in the early stage and install the placement on site in the later stage. When our sound reinforcement system is built according to the reasonable needs of the site, it enters the debugging stage of the sound reinforcement system. At this stage, various corresponding audio test software can be combined to test and calibrate the main parameters of the entire system to build a reasonable and standardized sound reinforcement system platform, which will lay a solid foundation for the subsequent tuning personnel to perform overall tuning based on subjective listening.
With the rapid development of the audio industry, the corresponding relevant standards are becoming more and more standardized and detailed, which makes the application of professional audio testing software and hardware more reasonable and standardized. From the measurement of the rough state to the improvement comparison after the building acoustics decoration, from the debugging of the sound reinforcement system to the acceptance and application of the sound reinforcement system, etc., professional audio test software may be required for participation and verification. In recent years, there are many similar software, but the main measurement functions are similar and each has its own advantages and disadvantages. For example, the commonly used SMARTLIVE, SYS TUNE, PAS, EASERA, SpectraLAB, Acoustics Tools, etc., although they are similar in overall functions, they still have their own characteristics in specific environmental applications. The following author will briefly describe the actual application of each test software in combination with actual application cases.
2. Software step-by-step comparison
For the convenience of comprehensive description, the use environment will be divided into several parts: building acoustics test, equipment system test and acceptance test. The use characteristics of each test software will be summarized through the comparison of the specific environment use.
1) Building acoustics test: measurement of reverberation, signal-to-noise and sound insulation, language clarity, transmission frequency characteristics, etc.
Building acoustics testing has become an indispensable and important step in audio engineering projects in recording studios, theaters, multi-purpose halls and stadiums. The entire building acoustic test is usually divided into two sections: before building acoustic treatment and after building acoustic treatment. The former refers to the acoustic parameter measurement of the rough space structure without any decoration, and the latter refers to the acoustic measurement during the construction and decoration process of the site or after it is completely completed, but both require step-by-step measurements in empty or full fields. The comparison of acoustic measurement parameters before and after is very objective and practical, which directly reflects the pros and cons of building acoustic decoration treatment. It can also be tested multiple times during the construction process to timely discover the unfavorable factors in the sound field and make targeted adjustments to improve the building acoustic plan, so that the final sound field characteristics reach the ideal state.
1.1 SpectraLAB software
In the early years, this type of software was often used to measure the reverberation time of the hall when performing various indoor cultural performances. Comparing the actual measurement results with the estimated reverberation time based on the sense of hearing is also a practical way to train the ears. Due to different hall structures and acoustic conditions, the reverberation time of each performance hall will be different. However, as a sound reinforcement technician, you should be aware of this because it is directly related to the on-site listening experience of instrumental music and vocals. Then you need to adjust the sound reinforcement plan according to the reverberation of different halls to obtain the best ratio of reverberation sound to direct sound. Generally, a professional test microphone will be placed 15 to 25 rows away from the center axis of the front stage. The specific placement can be adjusted according to the size and structure of the hall. The distance between the front and back or the stage entrance, the audience area, etc. can be adjusted appropriately. The average value can be estimated after multiple point tests.
After the test point planning is completed, the software Reverb window can be opened. Figure (1) is the interface displayed after the Reverb function is turned on. It is usually practiced to take the measurement value in RT60 mode, which is more suitable for measuring the transmission quality of hall music and capturing the reverberation time of the hall through burst audio signals. The red circle in the figure is the corresponding reverberation value of RT60 and RT30 in the wideband state, and the left part is the reverberation time of each fixed frequency band. For example, in the RT60 mode, the reverberation time of the low-frequency part centered on 125Hz is relatively longer than that of other frequency points, which will directly affect the diffusion characteristics of the low-frequency part and easily cause a decrease in the clarity of hearing. With the accurate grasp of these on-site reverberation parameters, targeted improvements can be made in the placement of speakers and the effect settings of vocals and instruments. For example, the corresponding frequency sound absorption treatment can be temporarily added, the frequency band with a slightly longer reverberation time can be appropriately fine-tuned for attenuation at the sound reinforcement site, the corresponding reverberation delay can be controlled for vocals and instruments, and other reasonable effect processing can be performed, so as to maximize the quality of on-site sound reinforcement.
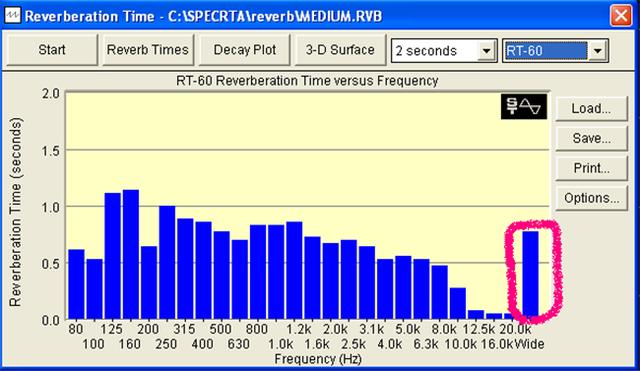
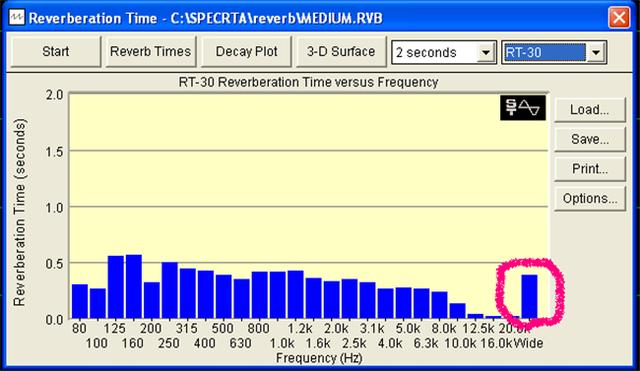
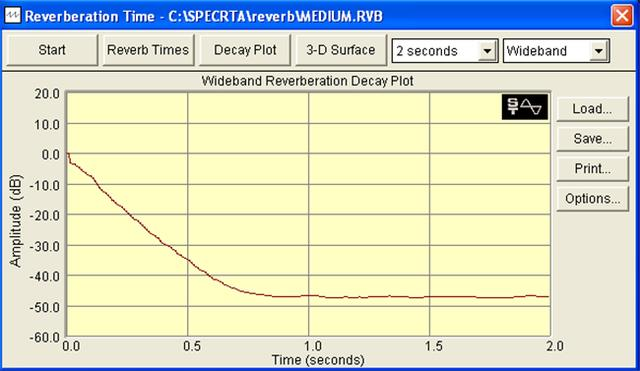
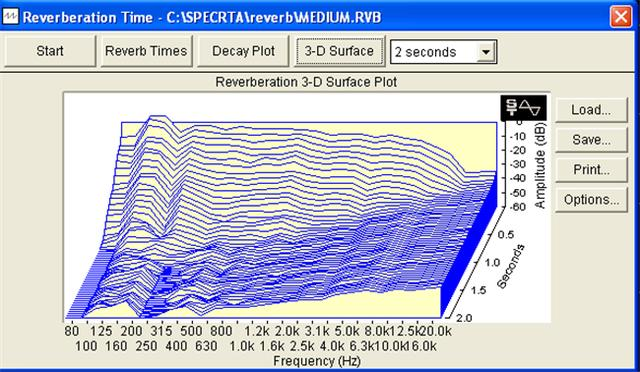
(Figure 1) SpectraLAB's various function interfaces in the reverberation time measurement mode
1.2 Acoustics Tools software
Figure (2) is the frequency reverberation time chart calculated by the Acoustics Tools software after the test. This is also the software interface diagram when the author was doing a hall acoustic test. Compared with the SpectraLAB software RTA mode, it has more graphical parameters of direct sound, reflected sound and background noise on the main window interface. At the same time, its reverberation time is given in the form of a chart, which is more intuitive and convenient. In addition to the reverberation time, important parameters such as C10, C20, C50, C80 related to the clarity index are also listed. The software also provides a professional test signal Room.wav, which can be said to be tailor-made for the reverberation time test. In some more stringent test sites and requirements, the wrong selection or poorly distorted test signal will also affect the measurement results. From this point of view, the Acoustics Tools software is considered more thoughtfully.

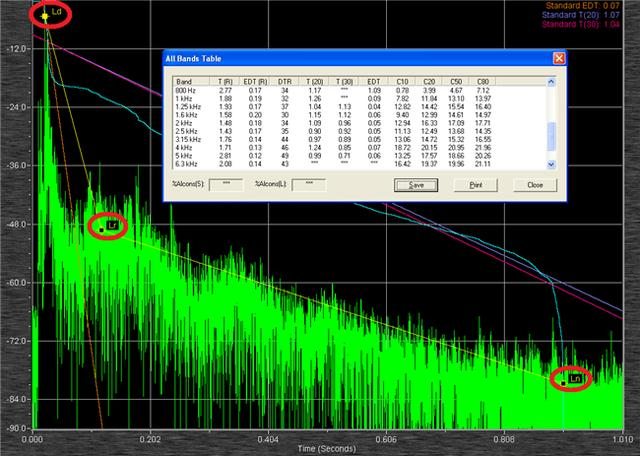
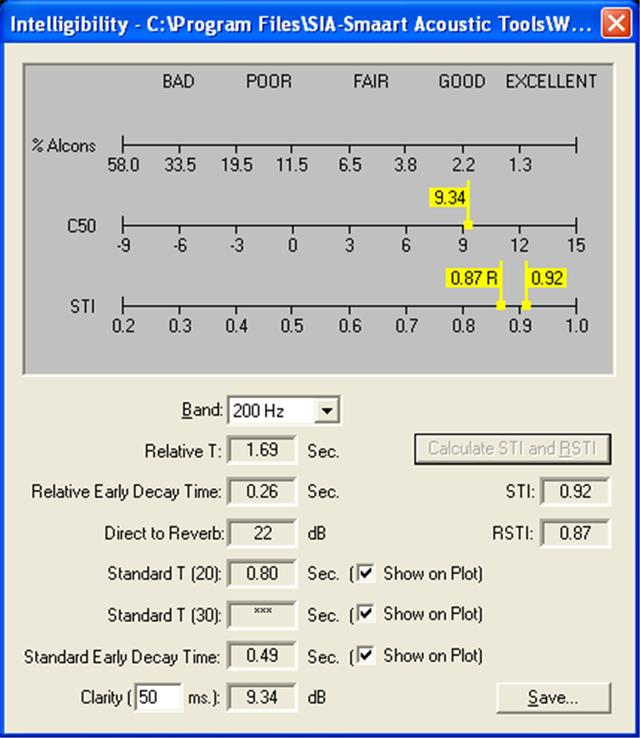
Figure (2) Display interface of reverberation time and clarity parameters of Acoustics Tools software
1.3 EASERA software
Figure (3) shows the reverberation time curve of EASERA software under EDT, RT (1/3rd) state. The principle of frequency-reverberation time correspondence is similar to Figure (1). EASERA software summarizes the reverberation time corresponding to the curve in a table in order. As the main indicator of the construction acoustics link, the measurement display of reverberation time is also very intuitive and clear, and can be directly submitted for quick reference by relevant personnel.
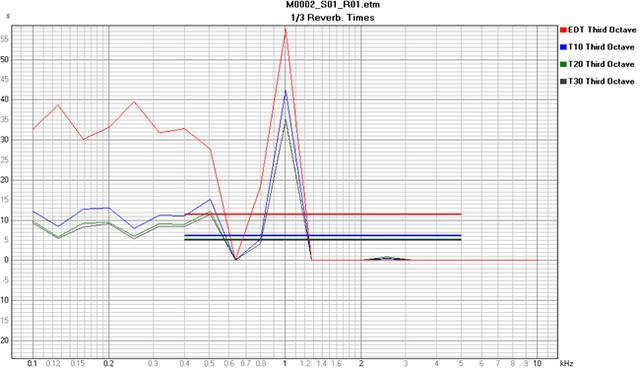
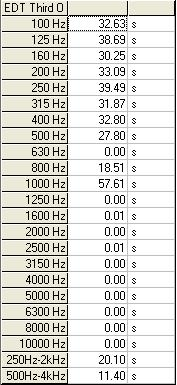
Figure (3) EASERA software reverberation time curve and time corresponding chart
1.4 Summary of building acoustics test comparison
From the comparison of the reverberation time measurement functions of the above software, each has its own characteristics. SpectraLAB can switch from RT10 to RT60 to view the reverberation time spectrum under different sound pressure level parameters. Acoustics Tools software displays the reverberation time in a graphical form with clarity parameters for each frequency. It is also very practical to integrate multiple measurement items into one by combining Ld direct sound, Lr reflected sound and Ln background noise, which is convenient for the corresponding optimization and improvement of building acoustics adverse factors. Correspondingly, the EASERA graph plus the table are already very clear and intuitive, especially the average reverberation time in the main frequency bands of 250HZ-2KHZ and 500HZ-4KHZ is given in the chart, which is a more practical parameter indicator for the overall evaluation of the acoustic environment. The current versions of Acoustics Tools and EASERA only provide variable measurement parameters from RT10 to RT30. When comparing with the RT60 standard, please pay attention to the reasonable calculation and conversion between them.
Figure (4) is a general reference table for the optimal reverberation time corresponding to the volume of various types of halls. Taking the Recording Studios curve as an example, as the volume of the room increases, the reverberation time in the room also increases accordingly. After measuring the volume of the room to be tested, the optimal reverberation time required after the building acoustic treatment can be accurately found according to the chart. This chart can play a good role in correcting and comparing the building acoustic decoration process. According to the actual data of the on-site acoustic test, it is summarized and counted. Strong sound absorption treatment is performed on the long reverberation time frequency band, and the sound absorption amount is reduced and controlled for the short reverberation time frequency band. Various sound-absorbing decorative materials are reasonably integrated and distributed to achieve the consistency of the reverberation time of each frequency point in the full frequency band, fundamentally building a good building acoustic environment.
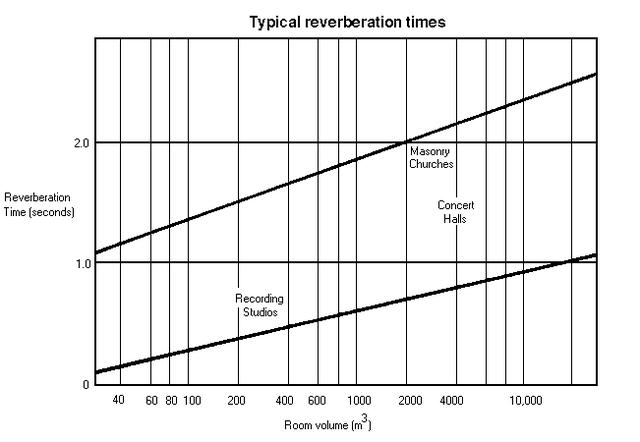
Figure (4) Hall volume and reverberation time correspondence diagram
2. Equipment system testing: frequency response display, delay compensation, phase correction, various types of distortion
System equipment testing is an indispensable step in the field of sound reinforcement. Whether the system can run stably in a good state and whether the equipment has real and reliable technical indicators are inseparable from the detection of professional audio software, which also provides specific parameter coefficients for audio system debugging.
2.1 SMARTLIVE software
Figure (5) is the real-time RTA and SPECTROGRAPH spectrum of SMARTLIVE software, which can be freely switched between 1/3-1/24 octaves according to visual habits and debugging requirements. In the 1/3 octave state, it can be compensated and adjusted with the system main equalizer until the system frequency characteristics are in the best flat state. According to the actual needs of the test, different Avg averages and Weight weightings can be selected for switching displays.
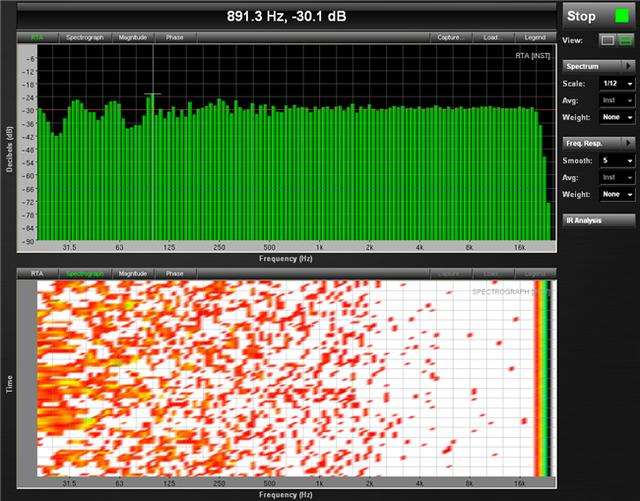
Figure (5) Real-time RTA and SPECTROGRAPH graphs of SMARTLIVE software
2.2 EASERA software
Figure (6) is also the real-time RTA and SPECTROGRAPH graphs of EASERA, which can be selected from 1/1-1/96 octaves. The large span and fine octaves are rare in all test software and are very practical. The gradient color scale progress bar between the two graphs can easily check the current signal level strength and sound pressure level.
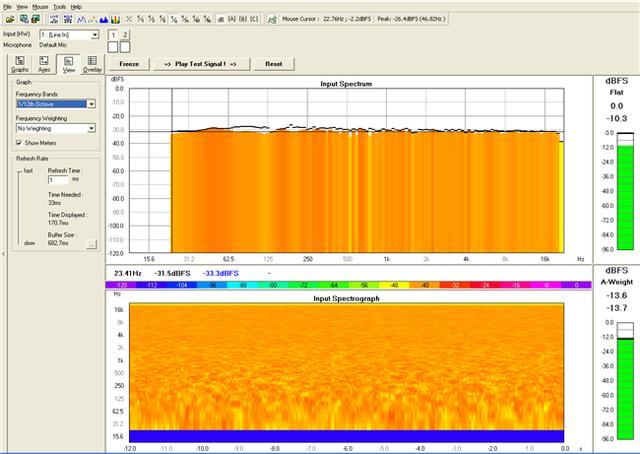
Figure (6) EASERA real-time RTA and SPECTROGRAPH graphs
2.3 SpectraLAB software
Figure (7) is the dual-graph interface of SpectraLAB. The biggest difference from the above two software is that it can display the working status of the left and right channels in real time. During the test, the frequency response of the sound reinforcement system signal picked up by the test microphone and the reference signal are displayed in a synchronized window, which is very practical for mutual comparison and verification between channels. The main acoustic parameter indicators of each channel, such as Peak Frequency, Total Power, Peak Amplitude, THD, THD+N, IMD, SNR, Delay Finder, etc., can be observed and compared in real time in a small floating window. However, it should be noted that the delay difference parameters between the two channels must be measured first and the reference signal channel must be inserted. In this way, the two channels can be truly synchronized in frequency display, making the on-site test comparison more accurate.
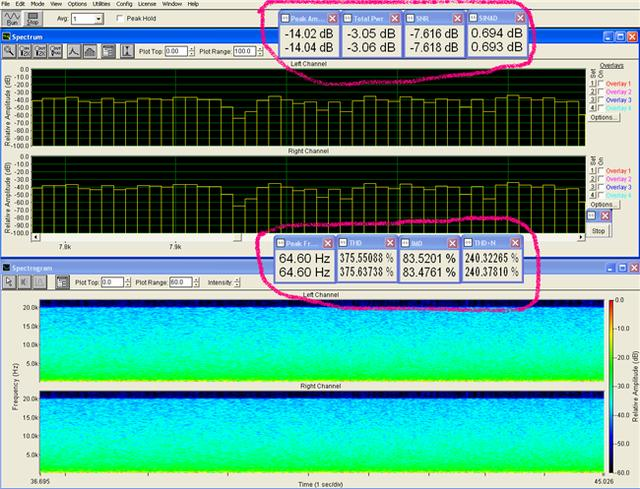
Figure (7) RTA and SPECTROGRAPH spectrum in dual-channel display mode of SpectraLAB software
2.4 PAS software
Figure (8) is the real-time spectrum of PAS software. This software is very good in spectrum display and test signals. It not only has common PINK and WHITE NOISE signals, but also has special detection signals for equipment such as SINE, SQUARE, SAWTOOTH NEG, and can select the frequency point from 1~22050 HZ. In addition, it is also a high-quality player that can play multiple audio format files and can realize fast conversion and channel separation between MP3 and WAVE audio formats. These functions are very suitable for adjusting the system in combination with objective measurement parameters and subjective listening experience.
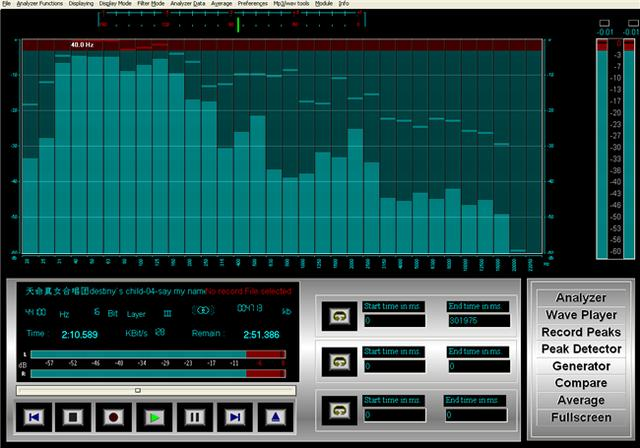
Figure (8) Real-time spectrum interface of PAS software
2.5 SYS TUNE software
Since this software comes from the same group as EASE and EASERA, they have their own characteristics and emphases in the distribution of core functions. Unlike the previous two products, which are compatible and complementary in terms of building sound measurement, SYS TUNE is more comprehensive and powerful in terms of sound reinforcement test application functions. In addition to the conventional spectrum, phase, reverberation time and even speech clarity measurement functions of the above-mentioned other software, it also meets the mode of comparing reference signals of up to 8 channels. With the corresponding sound card port, it is still relatively efficient and applicable for rapid comparison tests of large expansion systems. In addition, some functions of SYS TUNE can also be seamlessly embedded with other specified software and hardware to import calibrated virtual equalization and various test interfaces. As shown in Figure (9), the RTA status displayed in LAKE CONTROLLER.
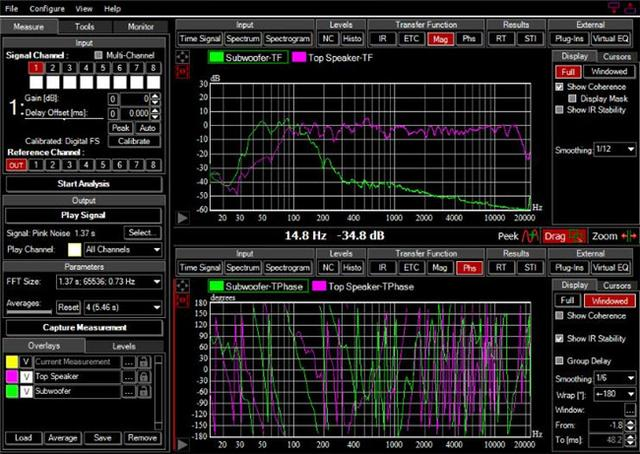
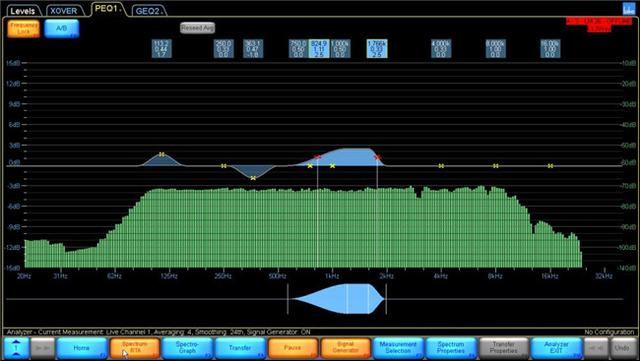
Figure (9) SYS TUNE test interface windows
2.6 Summary of equipment system test comparison
From the perspective of system equipment testing, SMARTLIVE is still widely used. This is mainly because its working state interface is simple and friendly and its function operation is convenient and clear. In particular, the delay measurement function can be done with one click and is suitable for basic detection and debugging of various types of sound reinforcement systems. EASERA's measurement parameters are relatively accurate. Its unique menu setting navigation can easily select measurement items according to different venues, types and sizes of background noise, which is very helpful in guiding measurement operators to use them reasonably and correctly and improving the accuracy of test parameters. SpectraLAB's dual-channel display is its highlight. Unlike other software that requires repeated switching of windows between different channels, which is not convenient for intuitive comparison, this functional mode is actually more conducive to on-site test personnel's observation and operation. The synchronous delay measurement and phase observation are also convenient and clear. In addition, its various distortion measurements are also unique. Through multiple draggable floating small windows, the common distortion parameters of the equipment and system are calculated, such as intermodulation distortion, total harmonic distortion, total harmonic distortion + total power of the noise, peak amplitude, peak frequency, signal-to-noise ratio and other system parameters, which are extremely convenient and practical.
SYS TUNE has many functions and its characteristics are also obvious. It has the basic functions of building acoustics measurement and focuses more on the testing of live sound reinforcement systems. For more complex full-frequency ultra-low systems, its multi-channel comparison reference characteristics can be fully utilized to avoid the inconvenience of repeatedly plugging and unplugging channels during testing, and quickly test and correct the main parameters of the full-frequency, ultra-low, monitoring and sound filling systems. The advantages of PAS software have been discussed above and will not be repeated. The frequency response measurement is very accurate, convenient and flexible, but it would be better if the common functions of delay measurement, phase analysis and distortion calculation can be improved.
3. Acceptance test: sound field uniformity, frequency response display, speech clarity, reverberation measurement, etc.
The indicators of the acceptance test results are directly related to the quality of the audio system engineering. There are also many items to be tested, such as reverberation time, maximum sound pressure level, sound field unevenness, speech clarity, system sound transmission gain and other acoustic indicators, and there are standardized requirements for the authenticity and accuracy of each test result.
EASERA software
Here, we need to describe EASERA software a little more because its test items are very complete and closely correspond to the main design indicators of the industry-recognized professional audio design software EASE, directly checking the design parameters of the bidding. For example, C7, C50, C80, STI, RaSTI, etc. related to clarity show its unique professional characteristics of acoustic testing.
Figures (10), (11), and (12) are respectively a summary list of each acoustic test parameter of EASERA software. The table is quite comprehensive and complete, and the results can be directly printed and organized into a system acceptance test report.

Figure (10) C (clarity) comparison table of EASERA software at different frequency states

Figure (11) T (reverberation time) comparison table of EASERA software at different frequency states
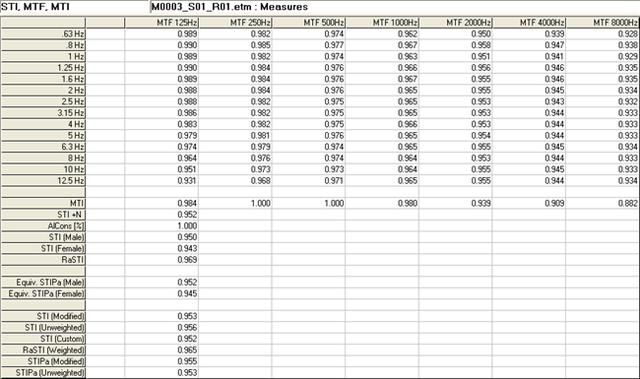
Figure (12) EASERA software frequency and STI, RaSTI and other parameters comparison table
III. Overall summary
This is a brief description of the practical function comparison of professional audio test software. The above comparison is only the relatively main single basic function. Other single comparisons of common functions such as delay measurement, phase correction, impulse response, etc. may be discussed in detail in future articles. After all, the practical functions of these software are very powerful, and there are still many practical functions that need to be discovered and used skillfully and flexibly in practical applications. In this regard, EASERA software is particularly obvious. It basically covers all the test items required in the field of building acoustics and sound reinforcement, and even the test items that are not commonly used in China are also very complete. Exploring and mastering these test items is also a good way to become familiar with foreign test technology.
Having powerful functions does not mean that they are applicable everywhere. Simple functions can often better meet the needs of the majority of practitioners for convenient use. For example, SMARTLIVE, SYS TUNE, SpectraLAB, etc., are more suitable for the rapid debugging of the performance sound reinforcement system and the monitoring of the main sound reinforcement indicators on site. The delay between full-frequency and ultra-low, main reinforcement and fill sound can be easily measured with one key. Its RTA spectrum can monitor the sound pressure and feedback frequency on site in real time to avoid overload of the sound reinforcement system, so that the operator can take countermeasures against sudden howling in the first time. SpectraLAB's dual-channel real-time comparison function is more suitable for equipment fault detection, especially for equipment lines with potential hidden dangers, its floating window can be used for long-term comparison monitoring to ensure system stability. PAS software is very suitable for the arrangement and standardization of music accompaniment materials based on its file conversion and channel separation functional characteristics.
The last point to emphasize is the selection, calibration and correct setting of microphones before various tests. For example, if there is no test microphone with qualified indicators when doing frequency response test, the test results will not be very accurate, because the frequency response defects of the test microphone will directly affect the frequency response test parameters. Of course, when testing system delay, sound pressure level or sound field unevenness, you may not have too high requirements for the frequency response characteristics of the test microphone, but you must also calibrate the sound pressure level of the test microphone in advance, otherwise the accuracy of the test will also be compromised. People who often use test software should know that before the formal test, the software must be correctly set according to the different test sites, test environments, test object characteristics, interface observation needs, and even test site temperature, humidity, and even altitude differences. If the relevant factors are ignored or the settings are not accurate enough, it will directly affect the final result of the test. It can be seen that the navigation menu function similar to EASERA is more humane and professional (as shown in Figure 13), which is particularly important for those who are still in the stage of exploration and learning of professional test software. In fact, this way of following the map is the best way for them to familiarize themselves with and master the test software.
Figure (13) EASERA main measurement function setting guide interface
In recent years, there are also some similar test software on mobile APPs. With the help of miniature test microphones, they can meet the parameter detection of relevant venues. If you don’t mind the size of the spectrum interface and the comprehensiveness of all functions, they can also be used as basic test tools for flexible on-site application. In addition, some well-known civilian audio and video brands have long been using integrated environmental scanning automatic compensation equalization to optimize the acoustic characteristics of the room to the maximum extent, so that all non-professional users can also use one-click fool-style operation to easily create and enjoy the "emperor's throne" of panoramic sound. Many high-end professional monitoring speakers have also been built-in and integrated with functions such as automatic room calibration. Through automatic compensation calculation, the monitoring system and the acoustic characteristics of the room are complementarily integrated to maximize the monitoring sound effect. This shows that the optimization measurement of the listening environment is an irreversible trend in both the professional and civilian fields, and it is a very correct direction for improving the listening level of the whole people.
Comparing the functions of the above-mentioned test software is not simply to evaluate the software, but to hope that everyone can find a test tool that suits their own working environment and usage requirements through this analogy. No matter how powerful and perfect the test software is, its main functions are relatively fixed. They all require the majority of practitioners to explore and master the combination of subjective listening and tuning skills to maximize the potential of various sound reinforcement systems. The fundamental principle is to make use of references instead of relying entirely on them, and to be able to choose and apply them according to different test needs, system conditions and usage environments, so as to achieve the ultimate goal of "convenient, flexible, efficient and accurate" in the field of modern audio testing, and lay a good platform foundation for the ultimate realization of excellent playback quality.

Tang Lei
He has been engaged in the audio industry for more than 20 years. He is one of the first-class tuners of the Ministry of Human Resources and Social Security and a senior engineer. (The above article is original by the author. Welcome to communicate with everyone.)
