Cinema Acoustics Simulation Software CARA
1. Room Basics (New Room Design Wizard)
New Room Design' allows you to easily set up a new room. There are four options: room plan template, dimensions, wall materials, and speaker configuration.
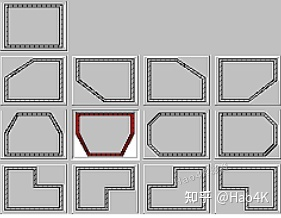
First, you need to select a room plan template, which can be a simple rectangle or another shape, such as an L-shape.
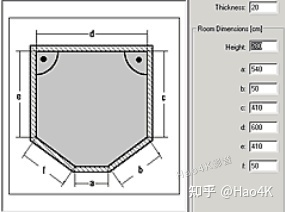
On the second page, you need to define the basic dimensions of the room. Press F10 to enter non-metric units such as feet. If you want to make a sloped ceiling, enter the maximum dimensions of the room.
Note: The height of the room cannot be changed after the wizard is closed.
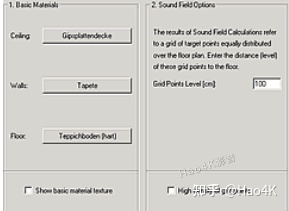
On the third page, select the basic materials. The materials of the floor, walls, and ceiling determine the acoustic properties (sound absorption coefficient).
"Grid points level" defines the height of the grid level, which is recommended to be flush with the listening ear. The default 100cm assumes that the listener is sitting on the sofa.
On the last page, select your speaker configuration. You can choose surround sound configurations such as stereo and quadraphonic.
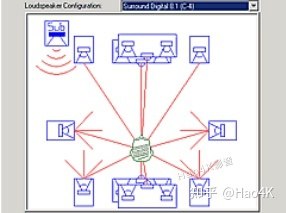
CARA 2.1 PLUS includes 10 digital surround configurations to meet future development needs.
2. Modify the room plan
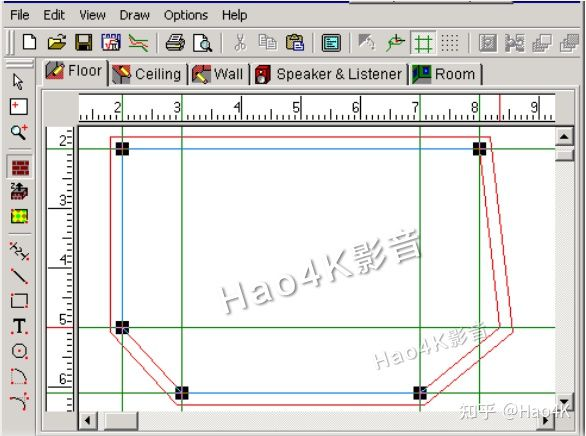
If your room type is not available in the room template, you can select the closest template and modify the plan. Select Floor Plan from the Draw menu.
Select a corner point or click on the inner edge of the wall to insert a corner point.
Use the 'Guidelines' auxiliary lines to accurately measure your room plan.
Click the surrounding markers to add and delete auxiliary lines. In the View menu, you can find more tools to facilitate room design.
They are:
'Snap to Floor Plan' Adapt to the plan structure
'Snap to Object Points' Adapt to object points
'Use Guide Lines' Adapt to auxiliary lines
'Use Grid' Adapt to the grid
3. Insert furniture
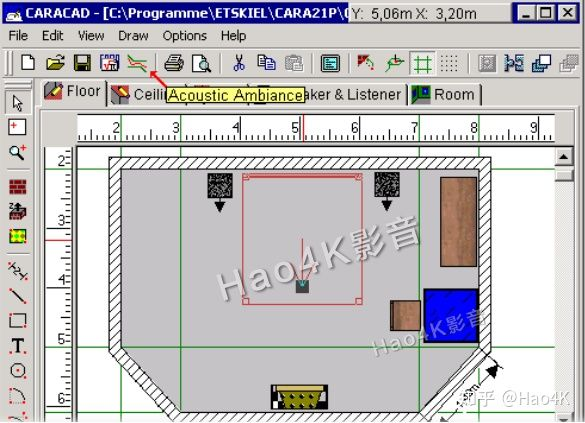
Select Load Group from the Edit menu to select furniture from the CARA furniture database to put into your room design. In addition, you can also customize furniture. Furniture is composed of several 3D objects and will be saved in the database and can be used in other room designs.
In the room design, 3D objects (furniture) can be distorted and moved at will. 3D objects are not only used to simulate furniture, but can also be used for many more applications, such as interior walls, door frames, window sills, joists, sloping ceilings, terraces, etc. However, you have to take into account that the calculation time for automatic position optimization, for example, increases with the number of reflective or absorptive surfaces in the room. Therefore, it is not necessary to consider all furniture. Furniture placed close to the speakers or the listener has the greatest impact on the sound coloration. Also, large furniture has a greater impact than small furniture.
In addition, the new CARA 2.1 PLUS function 'Acoustic Ambiance' evaluates the acoustic properties of your room and suggests some improvements.
Therefore, there are 2 suggestions for room design:
Create a new detailed room design, making sure to include all furniture and material surfaces. Detailed information is in the Acoustic Ambiance analysis.
Create a new minimal room design with only the main furniture. The calculation determines the sound field and the optimization of the speakers and the listening position, which takes less time but is less accurate.
4. Material surfaces
The materials for the room walls and 3D objects can be selected from the material database. The sound absorption coefficient of the material affects the reverberation time and thus the evaluation of the acoustic environment.
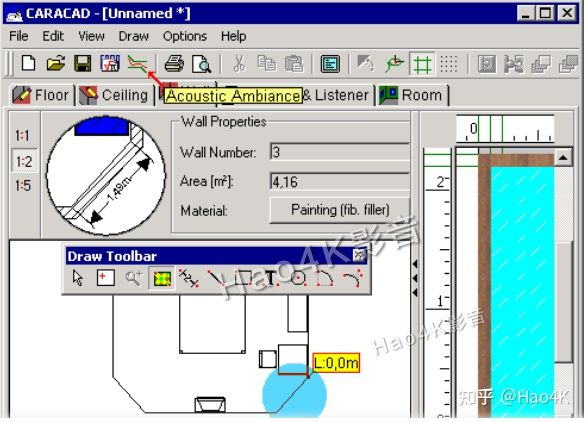
You can also define specific rectangular areas (material surfaces) inside the wall to simulate doors, windows, curtains, carpets. Usually their sound absorption coefficients are different from the respective wall surfaces.
Material surfaces and walls are two-dimensional and do not increase the calculation time, but 3D objects are three-dimensional, such as furniture, and will significantly increase the calculation time because 3D objects add sound absorption and reflection surfaces in the room.
Use guides to accurately determine the dimensions of material surfaces.
5. Material selection
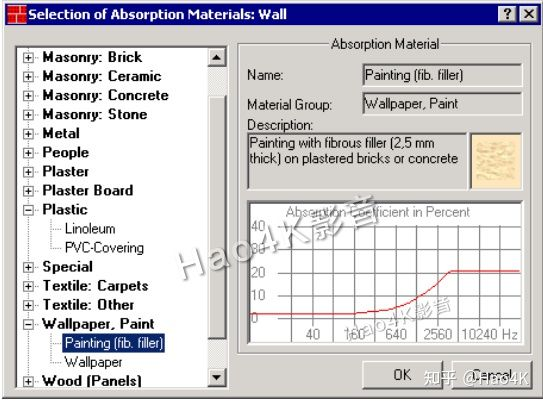
The materials for the room walls and 3D object surfaces are selected from the material database. The sound absorption coefficient specified in the material data is displayed in the dialog box using a frequency response graph.
'Description' contains a description of the selected material.
The colored areas show the material texture, which is used in the 3D view and in the 2D view of the floor, ceiling and walls.
'Material Groups' indicates which group the material is grouped into.
6. Acoustic environment
The acoustic environment of a room is mainly reflected by the reverberation time, or the time it takes for the acoustic field intensity (energy density) to decay by 60dB after the sound source stops. This time is closely related to the size of the room and the absorption of sound waves by the walls and furniture in the room. Strong absorption means a long reverberation time, weak absorption means a long reverberation time.
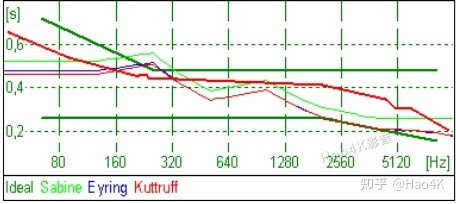
Long reverberation time: very echoing rooms
Long reverberation times occur in large, empty rooms, such as churches, and in rooms with strong reflections, such as tiled bathrooms. Many people describe the environment of these rooms as "live", or "echoing". In these rooms speech intelligibility is low, voices are shrill, and clapping can cause flutter echoes. These echoes may be more noticeable in different parts of the room.
Short reverberation time: cramped or boring rooms
Short reverberation times occur in rooms with a lot of sound damping. This makes the room feel smaller than it actually is. This can cause most people to perceive a room environment as "cramped" or "boring". Libraries are an example of this. People judge the size of a room based on the reverberation time.
Reverberation time can cause coloration
A typical room absorbs high frequencies more than low frequencies, causing the reverberation time of low frequencies to be much longer than that of midrange or high frequencies. The thin red line in the dialog box is an example of a room that feels ideal. The green line shows the upper and lower limits of the ideal reverberation time on the frequency spectrum. When the reverberation time deviates from this range, people perceive the sound as unnatural or with strong coloration.
CARA can help you improve your room environment
CARA will help you determine how much the reverberation time deviates from the ideal range in frequency. These calculations take into account the structure of the room as well as the furniture and materials used. These calculations are independent of the speaker system.
After calculation, CARA describes the acoustic environment of the room and suggests improvements. Usually this means adding or removing furniture, or changing the material of the room surface.
7. Speakers and listening position
The last step in the room design is to determine the listening position and select the speakers from the speaker library and place them in the actual position. If you place the listening position first, the orientation of the main speakers will be adjusted automatically.
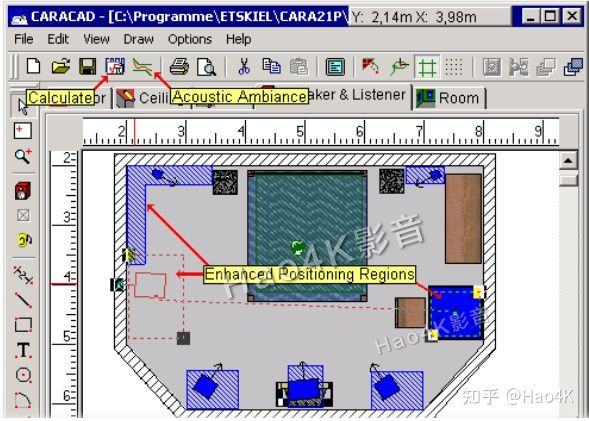
Adjust the positioning area (rectangle) around the speakers, as well as the positioning area of the sound absorption position. The 'Positioning Region' can be resized by a rectangular box. You can specify a special shape of positioning area, such as L-shaped or two separate rectangular areas. When the automatic position optimization is learned, the speakers and the listening position can be moved inside these areas to find the best position.
Right-clicking on the speaker or the listening position allows you to adjust the distance and vertical height of the positioning area from the floor. Once the design is complete, you can click CARACALC from the toolbar of the CARACAD module to start the acoustic calculation of the room.
8. 3D view of the 3D room
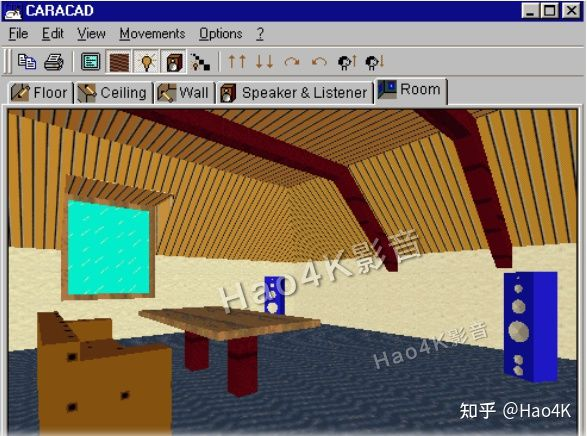
In the '3D View' module you can walk around in the virtual room you designed and check your design.
This is very useful in many cases, where it is difficult to imagine the 3D effect based on the floor plan. Especially if you have designed a complex room structure with sloping ceilings, dormer windows, etc.
1. Positional Optimization
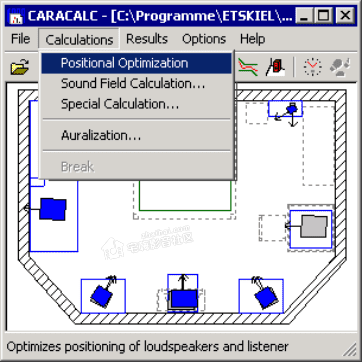
Before running the Positional Optimization, you must call the Parameter settings from the Options menu. For example, adjust the Maximum Reflection Order to 4 or 5.
In addition, you can use some symmetry constraints for the Positional Optimization. These involve your main speaker settings. You can require that the two speakers are symmetrically spaced from the front or side walls, which you can select from the Options / Variational Ranges menu.
During the optimization process, the positions of the speakers and the listening position in the main window will change after each optimization is completed. At the same time, if the SPL frequency response curve is displayed in advance (menu Results / Positional Optimization), it will also be updated.
The Calculation Tracer displays the optimization process step by step.
You can also interrupt the calculation at any time by selecting Break from the Calculations menu. The current optimization results are saved.
Occasionally, you need to restart the optimization, e.g. after adjusting the starting position, location area, maximum number of reflections.
2. Auralization
Using the sound card and headphones, you can perform listening tests in a virtual room, e.g. compare the differences between speakers in different positions.
Transient Room Response

The auralization calculation starts from the Calculation menu and displays the results in 'Transient Room Response' (TRR). TRR enables CARA to determine the influence of the sound coloration in the room on the music reproduction.
Auralization calculations use a fixed frequency step size, 0.1 ... 2.5 Hz. The total number of frequency base points is up to 500,000. In contrast, CARA calculations, such as special calculations and sound field calculations, use a fixed frequency step size and have larger granular points at 118 frequency base points (logarithmic scale).
TRR can be displayed and saved for further calculations. Via the menu Results/Auralization: RIA.
Auralization, listening test:
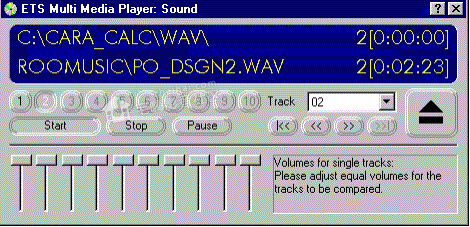
The auralization listening test compares the original music with the music reproduced by the loudspeakers in the room. To establish the music reproduction of the loudspeakers, the original music signal must be mixed with the room transient response. Both the original music signal and the reproduced signal are saved to the hard disk using sound files. The listening test is then carried out using ETS Multi Media Player.
The original music signal clip is required for the listening test. Choose the clip that you like best or that you think is good. The music clip should provide a very wide spectrum (bass, midrange and high frequencies) and be relatively balanced throughout the music clip. For example: Jazz, POP or rock music.
The CARA CD-ROM contains a variety of music samples.
You can also use ETS Multi Media Player to compare the reproduction of multiple loudspeakers. Compare different variations of the same room with the original music sample, such as different loudspeaker positions. Save the processed sound file and then compare it in the player.
Additional notes:
The room transient response (TRR) is the change in the sound pressure level at the listening position over time. A single Dirac (or delta) pulse is emitted from the loudspeaker, measuring the original sound at the listening position and the sound reflected once and multiple times from the walls, ceiling, floor, and furniture.
The bandwidth required for a true Dirac pulse is not suitable for loudspeakers. CARA takes into account the electro-acoustic conversion by selecting the type of loudspeaker in the calculation.
CARA's TRR calculation is based on the inverse Fourier transformation of the frequency response of the decomposed sound pressure at the listening position.
The TRR dialog box displays positive and negative sound pressure amplitudes, and the results of the squares of these amplitudes are displayed in the Reverb dialog box and can be compared with the high-resolution version in the special calculation.
3. Sound field calculation
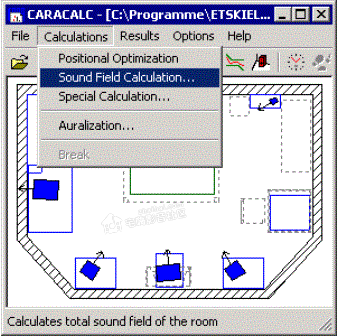
In addition to automatic position optimization, sound field calculation is the most commonly used and important function in CARA.
First, call Parameter from the Options menu, such as adjusting the Maximum Reflection Order to 4-5, for the next step of sound field calculation. If you don't mind spending more calculation time, you can increase this value.
'Sound Field Calculations' determines all the data about the room acoustics, with 1,000-3,000 evenly spaced grid points at the listener's ear level. These concern the sound pressure frequency response, position, speech clarity, and also the time correlation of the sound waves in the room.
The results of the sound field calculations are based on the current position of the loudspeakers.
Based on these results, you can find the best listening position taking into account coloration (linearity of frequency response), position (sound image) and speech clarity.
If the loudspeaker positions are fixed, this can replace 'Positional Optimization'.
4. Calculating Parameters
This dialog allows you to edit the calculation parameters. If you are not sure whether your adjustments are appropriate, click 'Standard' to use the default values, which are suitable for most situations.
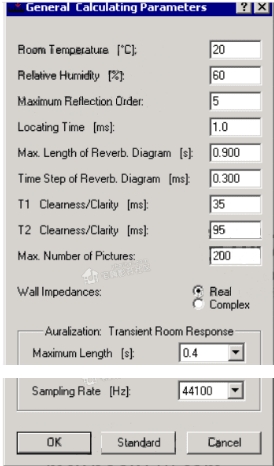
Maximum Reflection Order is related to the calculation accuracy, but also affects the calculation times 'Calculating Times'.
If your room contains a lot of polygons, the calculation time will increase significantly. In such cases you can reduce the 'Maximum Reflection Order' or remove some polygons (e.g. remove some furniture).
Enabling complex Wall Impedances will increase the calculation accuracy and calculation time. The default wall impedance is real.
Long calculation times lead to higher calculation accuracy, this is a basic rule.
The auralization parameters Maximum Length and Sampling Rate define the calculation of the room transient response. TRR is the basis of auralization (listening test). TRR contains all information about the impact of the room acoustics on the music reproduction in the room.
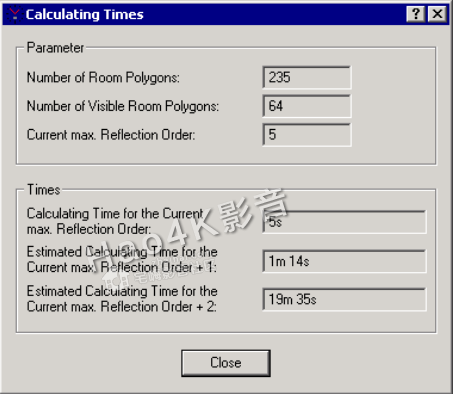
Calculation Times The 'Calculating Times' dialog shows the number of visible room polygons and total room polygons. The number of polygons depends on the actual room design and is determined by the CARACALC module before starting the first room acoustics calculation. Sound waves can only be reflected (and partially absorbed) on visible walls (polyhedrons).
In addition, the budget for the required calculation time also depends on the maximum number of reflections 'Maximum Reflection Order'.
The calculation time involves only one loudspeaker and one listening position. The total calculation time is a multiple of the number of loudspeakers and listening positions.
The calculation time for rectangular rooms (without furniture) is very short (up to 1000 times), because all reflected sound waves can be determined and tracked before the actual acoustic calculation.
5. Calculation Tracker
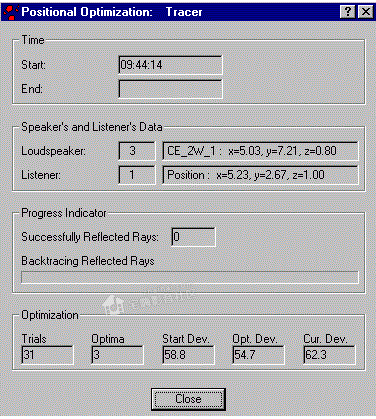
The tracker displays information about the current status of the acoustic calculation. The progress bar shows the time spent involving one loudspeaker and one listening position.
During the sound field calculation, the number of listening positions 'Listening Positions' shows the number that has not yet been calculated. The calculation can be stopped at any time, but the calculation results will be deleted.
During automatic position optimization, the number of trials 'Trials', the number of optimizations 'Optima', the start deviation 'Start Deviation', the optimal deviation of the current best position 'Optimum Deviation' and the current deviation 'Current Deviation' are displayed.
Position optimization can also be stopped at any time, in which case the current optimized position and the corresponding acoustic results can be saved to the hard disk.
6. Comparison: CARA and actual measurement

The figure above shows the comparison of the sound pressure frequency response calculated by CARA (red) and the actual measurement results (green).
Listening room size (L/W/H) 8.06/5.87/2.62 m. There is a foam rubber sound absorber in the front corner. In front is a 60cm deep bookcase with doors. There is also a bookshelf of about 8 square meters on the left wall.
The two-way test speaker is placed on a 90cm high stand, 3 meters away from the microphone, 1.6 meters away from the front wall, and 1.8 meters away from the left wall.
The frequency response is calculated using a maximum number of reflections of 12.
The comparison shows that the CARA calculations match the actual measurements very well. We do not know if other acoustic simulation software can match as well. It is possible that most other software do not consider the phase part of the complex sound pressure amplitude. In addition, the speaker model may not be very accurate.
For example, CARA simulates the sound radiation of the speaker using 4000 complex frequency responses (1000 directions around the speaker, 4 different distances) from 5 to 40,960Hz (1/9 octave interval).
