ODEON acoustic simulation design software principle
Abstract: Computer-aided sound quality design, such as ODEON, is increasingly used in architectural acoustic design. Acoustic simulation software can predict indoor acoustic parameters and evaluate and adjust acoustic schemes. Computer-aided sound quality design will be the future trend. Due to the complexity of acoustic problems themselves and the limitations of computers, the current research on auxiliary architectural acoustic design software is only in its infancy and cannot completely replace theoretical analysis and practical experience. Therefore, it is very important to have a deep understanding of the principles of computer-aided design, emphasize its reference value and limitations, and focus on combining it with architectural acoustic practical experience. This paper refers to relevant foreign literature and explains the basic principles of computer-aided acoustic design. It is hoped that the research results will be helpful to architectural acoustic designers.
Keywords: sound ray tracing method; virtual sound source method; sound ray beam tracing method; finite element method
Accurately predicting the sound quality of a room has always been the ideal pursued by architectural acoustic researchers. Who doesn't want to hear her sound effect when designing a concert hall drawing? Over the past 100 years, people have gradually discovered some physical indicators and revealed their relationship with the subjective sound quality of the room, including reverberation time RT60, early decay time EDT, impulse sound response, clarity index, etc. The prediction of sound quality parameters is the key to indoor acoustic design. At present, people use classical formulas, scaled models, and computer simulation to predict these parameters.
The complexity of indoor acoustics stems from the volatility of sound, and no simulation method can currently obtain absolutely true results. Based on the reference and research of foreign computer sound quality simulation literature, this paper compiles and summarizes the main simulation methods of indoor acoustics in order to deeply understand the basic principles, applicability and limitations of computer-aided architectural acoustic design.
1 Scaled model simulation and computer sound field simulation
Since the Sabine era, scaled models have been used in indoor acoustics, but the models are relatively simple and quantitative results cannot be obtained. In the 1960s, simulation theory and testing technology gradually developed and improved. After a lot of research and practice, scale models have basically achieved practical application in the measurement of objective indicators. Now, sound sources, microphones, and simulated acoustic materials can correspond to real objects, and the frequency band of instruments has also been expanded. Practical accuracy has been achieved in simulating common indicators such as reverberation time, sound pressure level distribution, and impulse response.
The principle of the scale model is the principle of similarity. According to Kutluf's derivation, for a 1:10 model, after the room scale is reduced by 10 times, if the wavelength is also shortened by 10 times, that is, when the frequency is increased by 10 times, if the sound absorption coefficient on the model interface is the same as the actual one, then the sound pressure level parameter at the corresponding position remains unchanged, and the time parameter is shortened by 10 times. For example, the reverberation time of 10 times the frequency is 1/10 of the reverberation time of the actual frequency. However, it is difficult to fully meet the requirements of similarity by physical means. The processing of air absorption and surface absorption similarity is the key to ensure the accuracy of simulation measurement. The scale model is the only practical method known at this stage that can better simulate the wave characteristics of indoor sound fields. However, due to the high cost of model production, the need to use nitrogen filling or dry air method to reduce high-frequency air absorption, and the difficulty in controlling the sound absorption characteristics of simulated materials, this method has great limitations.
With the development of software technology, the use of computers to simulate sound fields has become a reality. From a mathematical point of view, the propagation of sound is described by the wave equation, that is, the Helmholtz equation. Theoretically, the acoustic pulse response from the sound source to the receiving point can be obtained by solving the wave equation. However, when the indoor geometric structure and interface acoustic properties are very complex, people cannot obtain the exact equation form and boundary conditions, nor can they obtain valuable analytical solutions. If the equation is simplified, the result is extremely inaccurate and cannot be used practically. It is not feasible to use the wave equation to solve the indoor sound field by computer. From a practical point of view, the acoustic parameters of the room with a certain reference degree can be obtained through computer programs using the sound ray tracing method and the mirror virtual sound source method of geometric acoustics. However, due to the neglect of the wave characteristics of sound, the effect of processing high-frequency sound and near-reflected sound is better, and the simulation of all the information of the sound field is still very insufficient. In recent years, the use of methods based on finite element theory to simulate the high-order wave characteristics of sound has made some progress in low-frequency simulation.
2 Geometric Acoustic Simulation Method
The geometric acoustic simulation method draws on the theory of geometric optics, assumes that sound propagates in a straight line, and ignores its wave characteristics. The sound field is simulated by calculating the energy change in sound propagation and the area where the reflection reaches. Due to the low simulation accuracy and the huge amount of calculation for high-order reflection and diffraction, in most cases, geometric methods are used to calculate early reflections, while statistical models are used to calculate late reverberation.
2.1 Ray tracing method
The ray tracing method is to trace the propagation paths of "sound particles" emitted from the sound source in all directions. Sound particles continuously lose energy due to reflection and absorption, and determine the new propagation direction according to the angle of incidence equal to the angle of reflection.
In order to calculate the sound field of the receiving point, it is necessary to define an area or volume area around the receiving point to capture the passing particles. No matter how it is processed, wrong sound rays will be collected or some particles that should be lost. In order to ensure accuracy, there must be sufficiently dense sound rays and a sufficiently small receiving point area. For a sound propagating for 600ms in a room with a surface area of 10 m2, at least 100,000 sound rays are required.
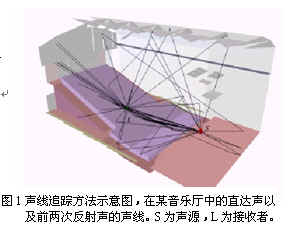
The early significance of the ray tracing method is to provide the area of near-order sound reflection, as shown in Figure 1. Recently, this method has been further developed to convert sound rays into cones or triangular cones with special density functions. However, there is an overlap problem and it still cannot achieve practical accuracy. The main advantage of ray tracing is that the algorithm is simple and can be easily implemented by computer. The complexity of the algorithm is a multiple of the number of room planes. By determining the mirror reflection path, diffuse reflection path, refraction and diffraction path of the sound ray, it is possible to simulate the non-direct reverberation sound field, and even simulate the sound field containing curved surfaces. The main disadvantage of ray tracing is that in order to avoid losing important reflection paths, a large number of sound rays must be generated, which brings a huge amount of calculation. Another disadvantage is that because the calculation results of ray tracing are highly dependent on the position of the receiving point, if the sound pressure level distribution is calculated, a large number of positions in the sound field must be taken. The more precise the result is required, the greater the amount of calculation will be. In addition, due to the wave characteristics of sound, the longer the wavelength, the stronger the ability to bypass obstacles. In the low frequency band, the ray tracing method cannot obtain reliable results.
2.2 Mirror virtual sound source method
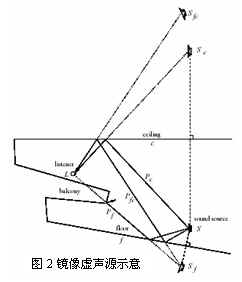
The virtual sound source method is based on the principle of mirror reflection virtual image, and uses geometric method to draw the propagation range of the reflected sound, as shown in Figure 2. The advantage of the virtual sound source method is high accuracy, and the disadvantage is that the calculation workload is too large. If the room is not a regular rectangle and has n surfaces, there may be n virtual sound sources with one reflection, and each of them may generate (n-1) virtual sound sources with two reflections. For example, a room of 15,000m3 has 30 surfaces and about 13 reflections in 600ms. The number of possible virtual sound sources is about 2913 ≈ 1019. The algorithm complexity is exponential, and high-order virtual sound sources will explode. However, at a specific receiving point, most virtual sound sources do not generate reflected sound, and most calculations are in vain. In the above example, only 2500 virtual sound sources out of 1019 are meaningful for a given receiving point. The virtual sound source model is only applicable to simple rooms with fewer planes or electroacoustic systems that only consider near-reflected sound.
2.3 Acoustic ray beam tracing method
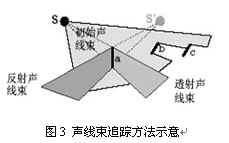
The acoustic ray beam tracing method is a development of acoustic ray tracing. By tracing the triangular cone acoustic ray beam, the reflection path of the interface to the sound source is obtained, as shown in Figure 3. Simply put, a series of sound beams that fill the two-dimensional space generated by the sound source are established. For each sound beam, if it intersects with the surface of an object in the space, the part of the sound beam that penetrates the surface of the object is mirrored to obtain a reflected sound beam, and the position of the virtual sound source that appears is recorded for further tracking. Compared with the virtual sound source method, the main advantage of sound beam tracking is that in non-rectangular space, fewer virtual sound sources can be considered geometrically.
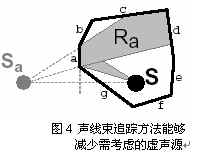
For example, as shown in Figure 4, consider the virtual sound source Sa mirrored from the sound source through plane a, then all points where Sa can be seen are in the sound beam Ra. Similarly, the intersection of the sound beam Ra and planes c and d is the reflection surface where Sa generates secondary virtual sound sources. Other planes will not generate secondary reflections of Sa. In this way, the sound beam tracking method can greatly reduce the number of virtual sound sources. On the other hand, the mirror virtual sound source method is more suitable for rectangular rooms because all virtual sound sources are almost visible. The disadvantage of the beam tracing method is that the geometric operation of three-dimensional space is relatively complex, and each beam may be reflected or blocked by different surfaces; another limitation is that reflection and refraction on curved surfaces are difficult to simulate.
2.4 Second sound source method
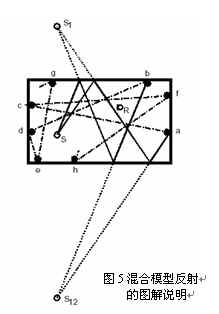
An effective method combines geometric acoustics and wave statistics, which is called the second sound source method. The second sound source method divides the reflection stage into early reflection and late reflection, and artificially determines a boundary of the number of reflections between early reflection and late reflection, which is called the "conversion order". Reflections higher than the conversion order belong to late reflections, and the sound line will be regarded as an energy line instead of a mirror reflection line. At this time, after the sound line hits the surface, a second sound source is generated at the impact point. The energy of the second sound source is the product of the initial energy of the sound line multiplied by the reflection coefficient of all surfaces hit during the previous propagation. As shown in Figure 5, two adjacent sound lines have 6 reflections, and the conversion order is set to 2. Sound lines with more than 2 reflections will be reflected in random directions according to Lambert's law. The first two reflections are mirror reflections, and the virtual sound sources are S1 and S12. In higher-order reflections of more than 2 times, each sound ray generates a second sound source on the reflecting surface. By calculating the response of the virtual sound source and the "second sound source", the reverberation time and other room acoustic parameters can be calculated.
In the second sound source method, it is very important to determine the conversion order. The higher the conversion order setting, the better the calculation results are not necessarily. As the number of reflections increases, the sound rays become sparse, and the chance of losing the virtual sound source increases during reverse tracing, which requires the sound rays to be dense enough. On the one hand, the sound rays are too dense, which is limited by the calculation time and memory. On the other hand, the problem is that many small reflection surfaces are detected in high-order reflections. Due to the wave characteristics, the actual reflection of these small surfaces is generally much weaker than the result calculated according to the geometric reflection acoustic law, so losing the virtual sound source of these small reflection surfaces may be more in line with the actual situation than calculating them. ODEON program experiments show that increasing the conversion order and increasing the density of sound rays may bring worse results. In general, the results produced by only 500 to 1000 sound rays in an auditorium are valuable, and the optimal conversion order is found to be 2 or 3. This shows that the hybrid model can provide more accurate results than the two pure geometric methods and reduce a lot of computational effort. However, the hybrid model must introduce the concept of scattering.
3 Scattering
The amount of sound scattered is the scattering coefficient, which is the ratio of non-specular reflection energy to total reflection energy. The scattering coefficient ranges from 0 to 1, s = 0 means all specular reflection, s = 1 means all some kind of ideal scattering. Scattering can be simulated in a computer model using statistical methods. Using random numbers, the direction of scattering is calculated according to Lambert's cosine law, while the direction of specular reflection is calculated according to the specular reflection law. The scattering coefficient, which takes values between 0 and 1, determines the ratio between these two direction vectors. Figure 6 shows the reflection of sound rays under the action of different scattering coefficients. For simplicity, the example is presented in two dimensions, but in fact the scattering is three-dimensional. In the absence of scattering, the sound ray tracing is completely specular reflection. In fact, a scattering coefficient of 0.2 is sufficient to obtain a good scattering effect.
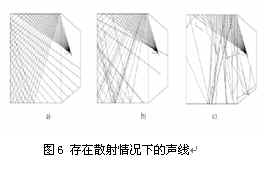
By comparing computer simulations with actual measurements, it is found that the scattering coefficient needs to be artificially set to about 0.1 on large and flat surfaces, and to 0.7 on very irregular surfaces. Extreme values of 0 or 1 must be avoided in computer simulations, firstly because it is impractical, and secondly because the calculation may result in deterioration. The scattering coefficient is also different for different frequencies. Scattering caused by surface size generally occurs at low frequencies, while scattering caused by surface fluctuations generally occurs at high frequencies. The difficulty in determining the scattering coefficient is one of the obstacles that affect the simulation accuracy of geometric methods.
4 Finite element method and boundary element method
The method of geometric acoustics ignores the wave characteristics of sound, so it is impossible to simulate the wave characteristics of sound waves, such as diffraction and refraction of sound waves. In the low frequency band, the wavelength of sound waves is longer and can pass through obstacles that high-frequency sound waves cannot pass through. Therefore, the geometric acoustic model cannot obtain accurate low-frequency calculation results. In order to solve this problem, the finite element and boundary element methods are proposed.
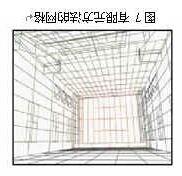
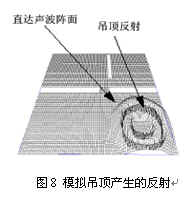
The acoustic wave equation can obtain accurate results, but at present only rectangular rooms with rigid walls can be solved analytically. This means that the wave equation of a general room cannot be solved analytically. In fact, any room sound field has its own wave equation and obeys the law of wave, so digital methods can be used to simulate and approximate the solution of the room's wave equation. The specific method is to subdivide space (and time) into elements (particles), and then the wave equation is expressed as a series of linear equations of these elements, and the numerical solution is iteratively calculated. In the finite element method, the elements in space are discrete (Figure 7, Figure 8), while in the boundary element method, the boundaries in space are discrete. This means that the matrix generated by the finite element method is relatively large and sparse, while the matrix generated by the boundary element method is relatively small and dense. Since the computational and storage overhead becomes unbearable with the increase of frequency, the "element" method is only suitable for small closed rooms and low frequency bands.
The advantage of the finite element and boundary element methods is that they can generate dense grids where needed, such as corners, which have a greater impact on the sound propagation of the room. Another advantage is that coupled spaces can be handled. The disadvantage is that boundary conditions are difficult to determine. Generally speaking, complex impedance is required, but it is difficult to find relevant data in existing literature. The characteristics of these two methods are that the results for a single frequency are very accurate, but when there is a bandwidth of octaves, the results are often very different. In practical applications, they have not yet achieved the same practical effect as geometric acoustics, and further research is needed.
References:
ODEON Manual
